
Søren Roest Korsgaard
The following analysis was drawn from my book: The New September 11th: Solving the COVID-19 Pandemic. You can download the article as an MP3 by clicking here:
Japan provides a crucial case study for understanding the COVID-19 pandemic because its constitution prohibited the government from imposing mandatory lockdowns. Consequently, mortality statistics will provide a clearer view of the impact of mRNA vaccines.
When the pandemic began, the population was the world’s oldest, and the concentration of people per area was among the highest as well, at 332.81 people per km2. However, the majority of Japan is mountainous, and the population is packed into narrow coastal plains, where the density is far higher than the country-wide average. Tokyo, for example, had over 6,000 people per km2 in 2020, but contained areas that were more than twice as populated.
If the official narrative were true, the country should have been an ideal feeding ground for the coronavirus, especially among the 29% of the population aged 65 and above. Against expectations, my peer-reviewed paper in Health Science Reports pointed out that there were 20,982 fewer deaths than projected in 2020 (Fig. 1) [1]. By massive contrast, Italy and Peru experienced an estimated 100,000 and 121,321 excess deaths, respectively, with strict lockdowns in place [2]. The case of Japan is simply incompatible with the premise for lockdowns and other harsh restrictions.
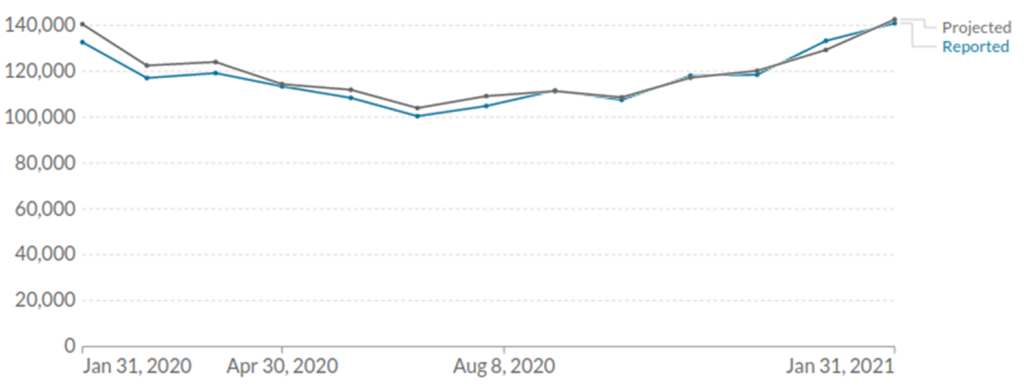
Figure 1: All-cause mortality in Japan vs. projected mortality from January 2020 to January 2021.
Cumulative excess mortality—the sum of the difference between observed and expected deaths over time—is an indispensable resource. When we observe this metric for Japan, several crucial facts readily emerge: In 2020, there was a mortality trough, which grew larger over time, only momentarily interrupted by seasonality in December. For example, from January 31 to July 31, the deficit widened from 7,818 to 30,363. The downward trend carried over into early 2021, and from December 2020 to March 2021, the deficit grew by a further 9,722 deaths. Subsequently, mortality dramatically reversed course and increased continually, a trend that held firm throughout the following three years (Fig. 2).
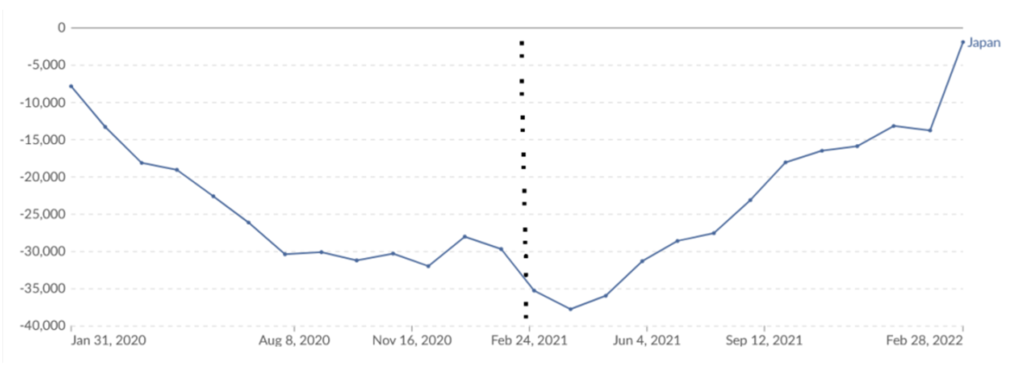
Figure 2: Cumulative excess mortality in Japan. The dashed line indicates when mass vaccination began.
Using a quasi-Poisson regression model and data from the Ministry of Health, Labour, and Welfare, a study in Public Health determined that a significant rise in mortality began on April 12, 2021. The first Pfizer vaccine had been injected into someone’s shoulder muscle 54 days earlier, a stunning temporal association [3]. Thus, when there was no vaccine, fewer people were dying, but within two months of the rollout, the established downward trend had broken, and when 2023 had concluded, there had been 209,871 surplus deaths for the pandemic period. According to some sources, the nuclear blasts at Nagasaki and Hiroshima killed an equivalent number of people.
It turns out that this figure is misleading if we want to quantify the post-vaccine mortality impact. The reason is that the sum is widely distorted by the pre-vaccine mortality deficit and trend, meaning that even more people died. Indeed, one can easily be misled if previous trends are not given attention. From January 2020 to February 2021, for instance, there was no cumulative excess mortality because the deficit masked the subsequent rise. In keeping with the official narrative, governments have seized upon this fact to claim that COVID vaccination is perfectly safe. It is easy to illustrate that this is highly misleading. I have calculated that, had the mortality rate not exploded in early 2021, one could have administered cocaine to 10 million Japanese citizens throughout the year, and there would still have been no cumulative excess mortality at all![*] It is therefore very clear that careful analysis is required.
The question then becomes, how many people died above the norm in 2021 and beyond? The Ministry of Health, Labour, and Welfare publishes a wealth of vital statistics, including the raw death count from all causes [4]. Using 2020 as the reference point, the increases in raw deaths are shown below:
2021: An increase of 67,101 deaths.
2022: An increase of 196,295 deaths.
2023: An increase of 203,261 deaths.
2024: An increase of 232,623 deaths.
The sum of these equals 699,280 deaths over the four-year period. Based on the average pre-COVID trend from 2015 to 2019, we would only expect a gradual rise of 22,646 deaths per year, or a cumulative total of 226,460 from 2021 to 2024, leaving us with an unexplained 472,820 deaths. This is an approximation, of course, but the methodology is justified for several reasons. First and foremost, the actual data shows that mortality was on a downward trajectory in 2021, but then vaccines were rolled out and the course was reversed. Furthermore, the underlying causes of the deficit also persisted in 2021. In other words, in the absence of the factor that reversed the trajectory, 2021 would at the very minimum have experienced no surplus mortality.
The primary engine that forced Japan’s death rate to shrink in 2020 was the disappearance of influenza, which continued the following two years, and the virus played little part in the catastrophic mortality in 2023 and 2024. This is not an artifact of deprioritized testing since even pneumonia deaths dropped by 23% in 2021 versus 2019. It is well-known that many pneumonia deaths are a complication of an influenza infection, but the complete picture remains more complex: the 2020 deficit vastly exceeded influenza’s predicted contribution.
These findings support the hypothesis that the trend from 2020 persisted, which, if true, would imply that more than 67,101 people died in excess the following year. On the other hand, one must also assume that some of the lives saved will create a larger group of susceptible people, eventually adding to death rates. Critics might also argue that extrapolating the 2015-2019 average into the future results in an underestimation of mortality. Overall, while arguments could be made for and against the estimated figure of around 472,820, I believe it is unlikely to be a significant over- or underestimate. The question then becomes: What caused this tremendous explosion in deaths?
A study in the Journal of Epidemiology quantified that it was largely driven by “senility”—a catch-all “garbage code” doctors often use in lieu of investigating further when a senior citizen dies [5]. Additional contributors included heart disease, COVID-19, cancers, and “other causes not classified as major causes.” These classification changes are evidently highly consistent with the established properties of mRNA vaccines (Japan is the most mRNA-vaccinated country on Earth). First, deaths resulting from an autoimmune mechanism discovered by distinguished pathologist Dr. Arne Burkhardt would, for example, very likely be attributed to senility among the elderly [6-7]. Second, a shift in antibody profiles, resulting from mRNA vaccination, would predictably result in surges of positive PCR tests and COVID deaths [7]. As seen below, both metrics exploded in the post-vaccine period (note that Japan significantly scaled down testing in 2023).
| Year | PCR-positive cases | COVID-19 Deaths |
| 2020 | 230,304 | 3,414 |
| 2021 | 1.5 million | 14,979 |
| 2022 | 27 million | 39,120 |
| 2023 | 4.7 million | 17,181 |
What is this shift in antibody profiles? German immunologists have demonstrated that repeated vaccination with the Pfizer vaccine induced a specific immunological phenomenon known as class switching, whereby the type of antibody produced against SARS-CoV-2 changed over time [8]. Initially, after two doses, the primary response consisted of pro-inflammatory IgG1 and IgG3 antibodies, which effectively recruit immune cells to destroy the virus. Gradually, and much more so after a booster dose, the antibody profile shifted radically. The production of IgG4—a “tolerant” or non-inflammatory antibody—surged from a mere 0.04% to 19.27%. Unlike its predecessors, the IgG4 subclass functions less aggressively because it is less effective at recruiting immune cells to eliminate the virus. The implication, therefore, is that vaccination produces the opposite of the intended effect.
Class switching bridges the gap between biological theory and the epidemiological reality that mass vaccination was associated with unprecedented spikes in positive PCR tests and COVID-assigned deaths. Particularly revealing are huge outbreaks within highly vaccinated populations, which experienced few cases and deaths in 2020. Let’s consider, as an example, a landmark prospective study from the United States [9].
The study, featured in Open Forum Infectious Diseases, enrolled 45,064 vaccinated and 5,953 non-vaccinated employees of the Cleveland Clinic Health System and followed them over a 26-week period. During this time, 4,424 workers tested positive. Regarding prior vaccination history, 4.9% had received one dose, 29.4% two doses, 46.3% three doses, 7.5% four doses, and just under 1% had received five or six doses.
Deceptively, the abstract claimed that vaccination provided “modest protection overall” against the BA.4/5 strains [9]. However, buried in the data, the paper directly stated that “the greater the number of vaccine doses previously received, the higher the risk of COVID-19” [9]. In black and white, the paper also warned that the vaccines may be hazardous: “It is important to examine whether multiple vaccine doses given over time may not be having the beneficial effect that is generally assumed” [9].
Given all of the data, what do you think reversed mortality in early 2021 in Japan and resulted in the largest mortality crisis since World War II?
[*]To perform the calculation, I used data from the United States. In the year 2000, there were 3,544 cocaine-related overdose deaths (Jones et al., 2017) and an estimated 1.2 million habitual users (National Household Survey on Drug Abuse, 2001), yielding 295 deaths per 100,000 users.
[1]. Korsgaard, Søren Roest. “All-cause mortality and Japan’s early countermeasures.” Health science reports vol. 7,2 e1905. 15 Feb. 2024, doi:10.1002/hsr2.1905 https://pubmed.ncbi.nlm.nih.gov/38361802/
[2]. Ramírez-Soto, Max Carlos, and Gutia Ortega-Cáceres. “Analysis of Excess All-Cause Mortality and COVID-19 Mortality in Peru: Observational Study.” Tropical medicine and infectious disease vol. 7,3 44. 5 Mar. 2022, doi:10.3390/tropicalmed7030044 https://pmc.ncbi.nlm.nih.gov/articles/PMC8950420/
[3]. Nomura, S et al. “Excess deaths from COVID-19 in Japan and 47 prefectures from January through June 2021.” Public health vol. 203 (2022): 15-18. doi:10.1016/j.puhe.2021.11.023 https://pubmed.ncbi.nlm.nih.gov/35016070/
[4]. Ministry of Health, Labour and Welfare. “Summary of Vital Statistics: Numbers and Rates (Final Data)” https://www.e-stat.go.jp
[5]. Tanaka, Hirokazu et al. “Changes in Mortality During the COVID-19 Pandemic in Japan: Descriptive Analysis of National Health Statistics up to 2022.” Journal of epidemiology vol. 35,3 (2025): 154-159. doi:10.2188/jea.JE20240158
[6]. On COVID vaccines: why they cannot work, and irrefutable evidence of their causative role in deaths after vaccination https://doctors4covidethics.org/on-covid-vaccines-why-they-cannot-work-and-irrefutable-evidence-of-their-causative-role-in-deaths-after-vaccination/
[7]. Pathology Conference https://report24.news/pathologie-konferenz-impfinduzierte-spike-produktion-in-gehirn-u-a-organen-nun-erwiesen/
[8]. Irrgang, Pascal et al. “Class switch toward noninflammatory, spike-specific IgG4 antibodies after repeated SARS-CoV-2 mRNA vaccination.” Science immunology vol. 8,79 (2023): eade2798. doi:10.1126/sciimmunol.ade2798 https://pubmed.ncbi.nlm.nih.gov/36548397/
[9]. Shrestha, Nabin K et al. “Effectiveness of the Coronavirus Disease 2019 Bivalent Vaccine.” Open forum infectious diseases vol. 10,6 ofad209. 19 Apr. 2023, doi:10.1093/ofid/ofad209 https://pubmed.ncbi.nlm.nih.gov/37274183/